

CEO & Managing Director
Optimization is the Key for a Successful Retail Store
Optimization is crucial in retail, and Ariadne's latest insights reveal key strategies for success. Data shows customers travel up to 28 km for strong brands and only 22 km for smaller stores. A single, well-designed store path can boost sales significantly, as every added shortcut may decrease revenue by up to 18%. Encouraging loyalty is also vital; a robust program can achieve a 27% signup rate, offering substantial engagement and sales opportunities.
In the Figure 2 below we are presenting the correlation between corruption of a country and its corresponding growth. The trend appears positive... until it isn't. Take a look for instance at the Republic of Congo. It is a very unregulated economy, according to this data, one would expect that the trend line, which is formed between India and USA, might continue, and Congo Republic might have had infinite growth. Unfortunately, Congo Republic is not as developed as USA and it is not developing faster than India, because growth needs optimization.
Figure 2: Direct your attention to the Republic of Congo, India, and the USA to discern a distinct pattern: corruption may offer advantages in a developing nation but ceases to be beneficial in the context of a developed country.
This figure resonates deeply with us at Ariadne, as it mirrors the developmental stages we routinely witness in retail stores. Specifically, when we analyze daily sales figures in relation to the time customers spend waiting in queues, it sheds light on the overall customer experience.
Have a look to the following Figure 3 for example. You will notice a striking similarity. While a store might successfully serve 50 customers in a day, with some customers to even be willing to endure queues for up to 7.7 minutes, the goal of accommodating 200 customers within the same store location can only be achieved via optimization of the customer experience.
Figure 3: A parallel pattern emerges when we examine the relationship between the time individuals spend queuing at the cashier and the frequency of their purchases, akin to the pattern observed in the correlation between corruption and a country's growth.
Optimization
But what precisely can be optimized within a retail store? The answer unfolds across a spectrum of elements categorized into four key areas: ( a ) Brand Awareness, ( b ) Store Layout, ( c ) Employee Scheduling, and (d) Omnichannel Marketing.
About Ariadne
Ariadne is a high-tech company with a global presence, which provides physical organizations with comprehensive and detailed real-time customer and visitor analysis, for the optimization of the operation of their stores, and the improvement of their customer service.
Ariadne is characterized as the most precise solution that is also certified and fully compliant with GDPR. Ariadne serves large companies around the world and is trusted by companies from different sectors and various industries.
During the last five years we have served a plethora of retailers, and we always notice a finite set of emerging patterns. In this article we aim to share some of them.
Disclaimer
We do not argue that we know everything… and we do not argue that all patterns can fit all use cases. We only share some findings that seem to follow particular trends. Many customers, products and product areas may not follow these trends. These ”outliers” have been excluded from the report, and exceed the focus of this post.
Let's begin!
Brand Awareness
Brand awareness answers the following three questions:
- How far will a customer travel to visit your store (Catchment Area)?
- How many people will enter your store when they are passing-by (Brand Awareness)?
- How often your customers will return back to your store (Loyalty)?
How far will a customer travel to visit your store?
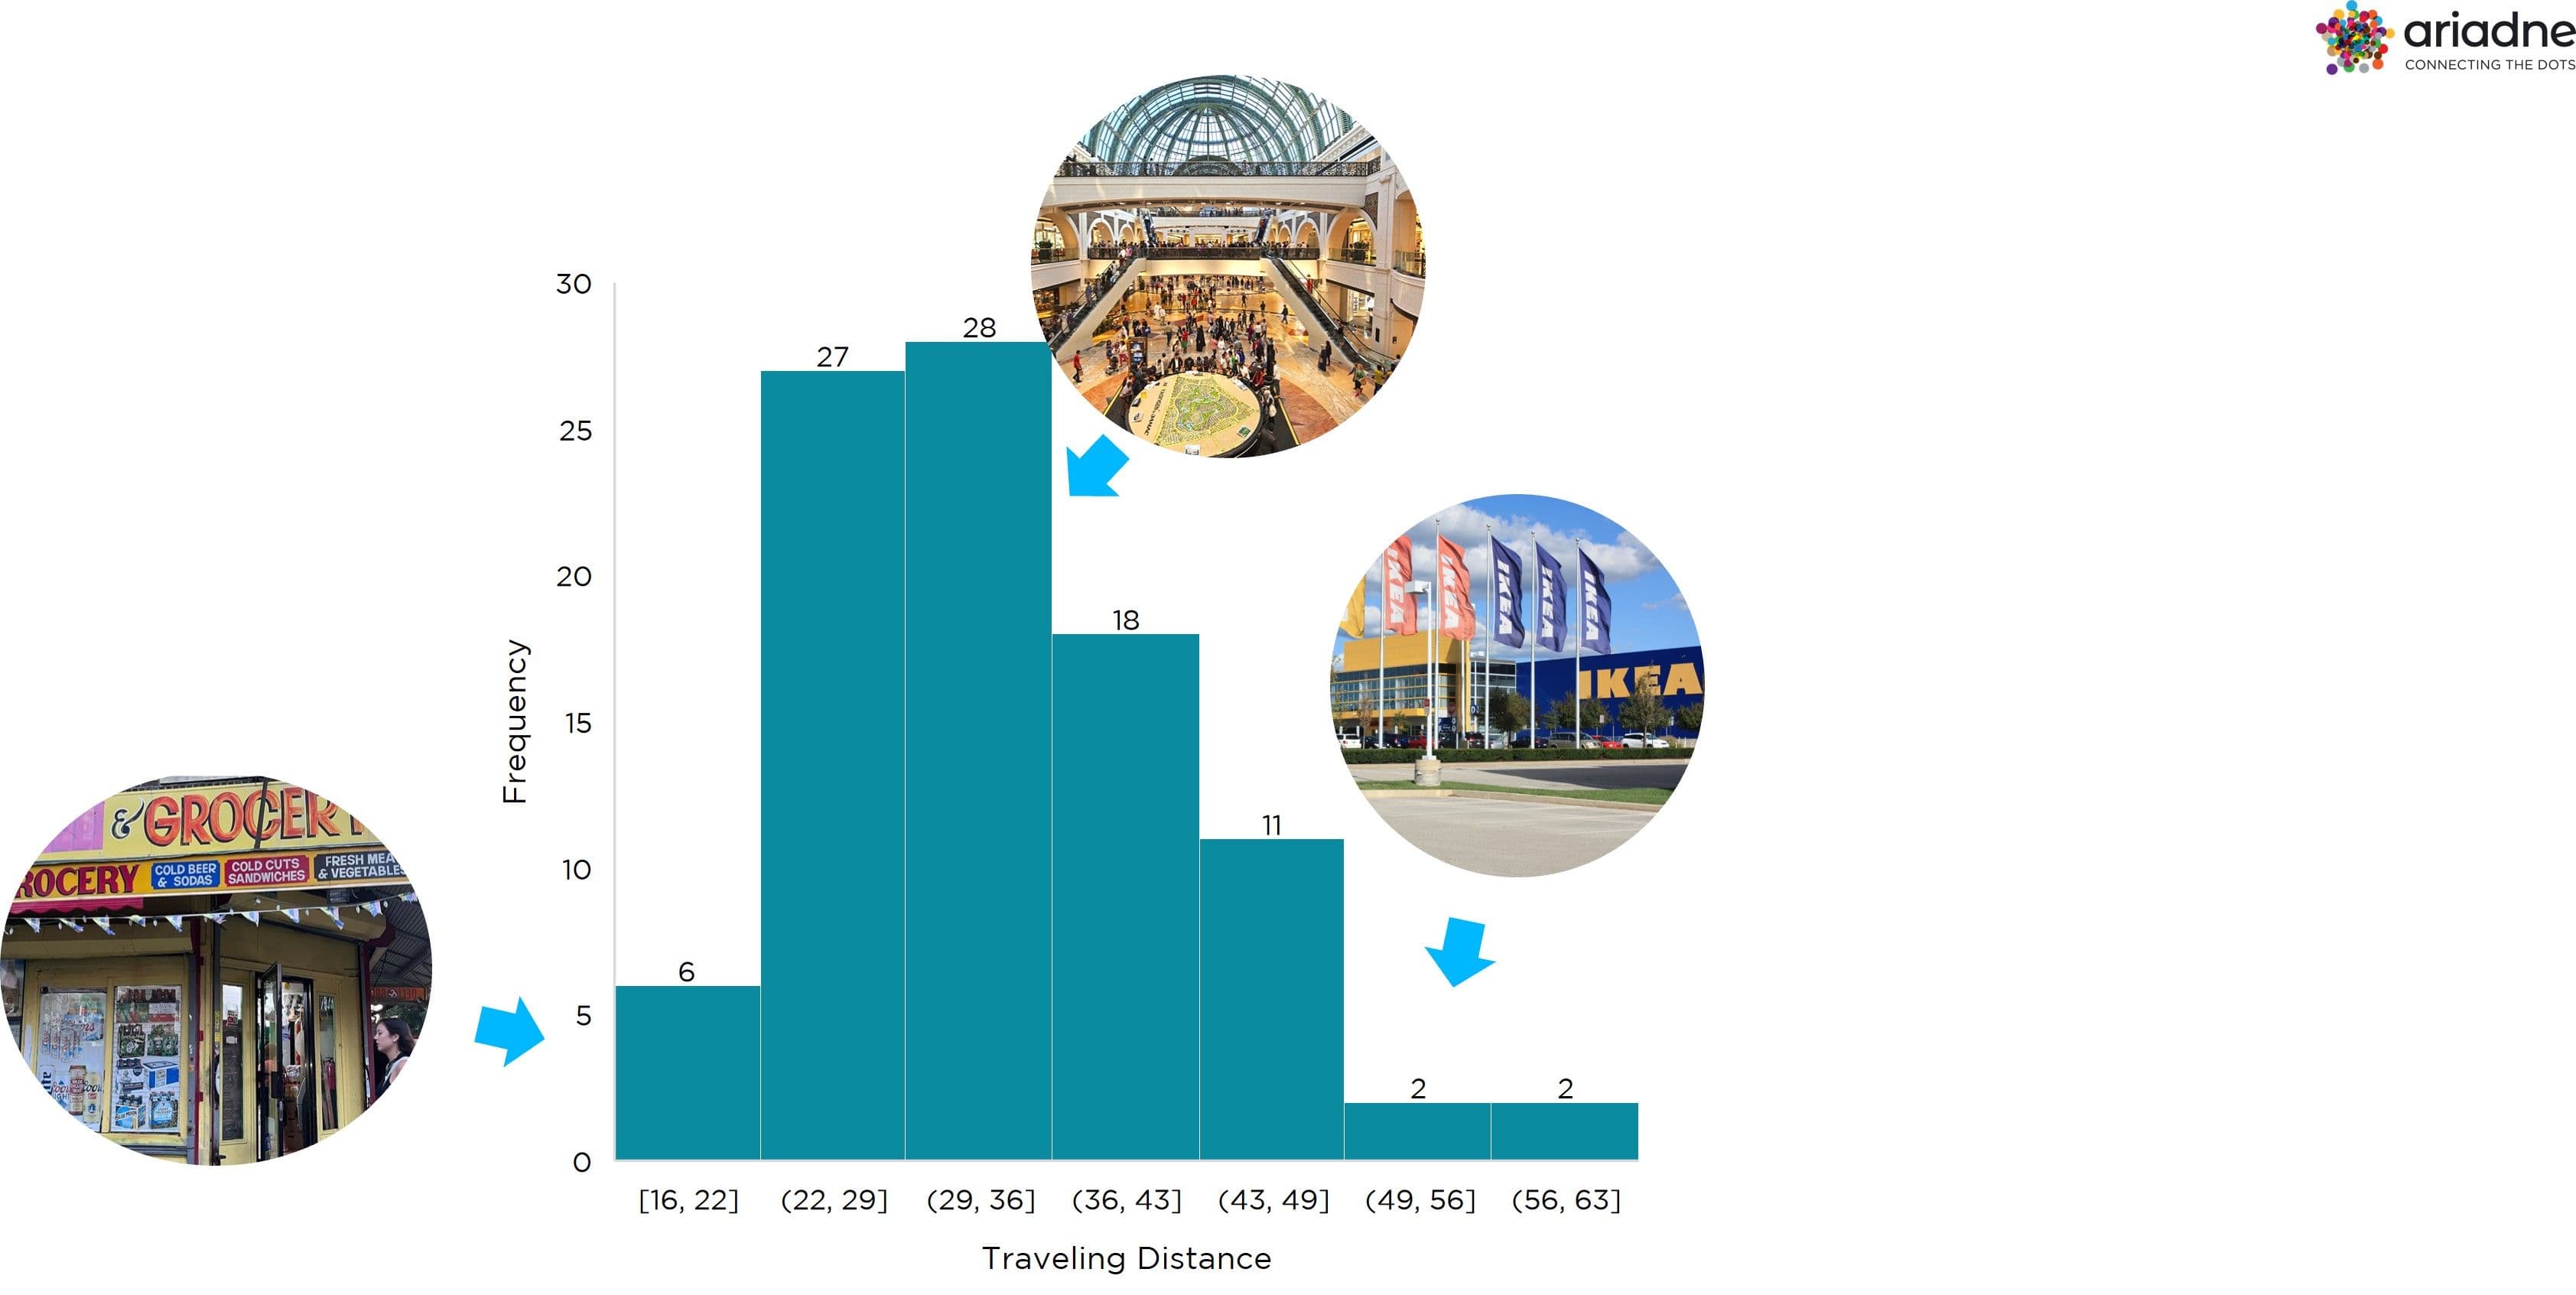
Figure 4: An illuminating histogram portraying the catchment areas of various retailers.
After analyzing various assets (Figure 4), including family businesses, local brands, and global leading brands, a clear trend emerges. As depicted in the figure, customers are typically willing to travel a median distance of 28 kilometers. This trend is especially notable for robust local brands, or by shopping center chains. In contrast, smaller family businesses attract customers within a more limited radius, not exceeding 22 kilometers. Notably, establishments with stronger brand recognition or those operating in more monopolistic sectors, such as airports, can draw customers from distances as far as 60 kilometers.
* median distance is not referring to the median distance of all visitors of an asset but the median value among all maximum distances of all assets that have been taken into account for generating this report.
How many people will enter your store when they are passing-by?
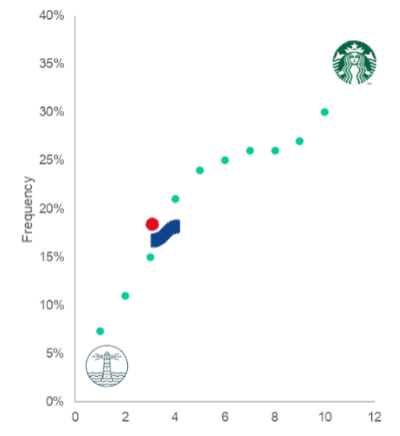
Figure 5: A histogram depicting the frequency of people entering a store in correlation with the maturity of the represented brand.
In order to convince a passerby to enter your store, two scenarios may have unfolded. Either you've executed effective marketing, making your store the intended destination for this person, or you've successfully designed an appealing shopping window that convinced the passerby to enter. As illustrated in the Figure 5, the conversion of passersby to visitors ranges from as low as 4% for very local brands opening their first store to as high as 33% for Starbucks, an established global brand.
How often your customers will return back to your store?
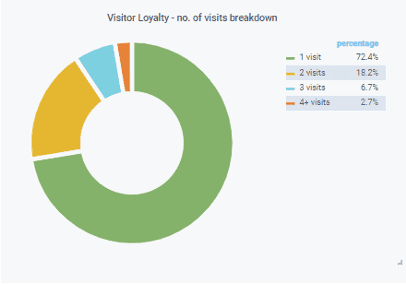
Figure 6: A pie chart provides a visual breakdown of the distribution of visitors returning to the store within a three-month period.
Regardless of your brand's strength, if you focus on exceptionally high customer satisfaction, your customers will return to your store. During a three-month period (Figure 6), there is a 18% chance they will return twice, a 6.7% chance of returning three times, and a 2.7% chance of returning four or more times. Loyal customers are 60% more likely to make a purchase, and they tend to consume 40% more than first-time customers.
Store Layout
Store layout offers a plethora of opportunities for optimization, with three key main considerations:
- How far are customers willing to walk inside your store?
- What should be the optimal size of a product area?
- How many alternative paths should be introduced within your store?
How far are customers willing to walk inside your store?
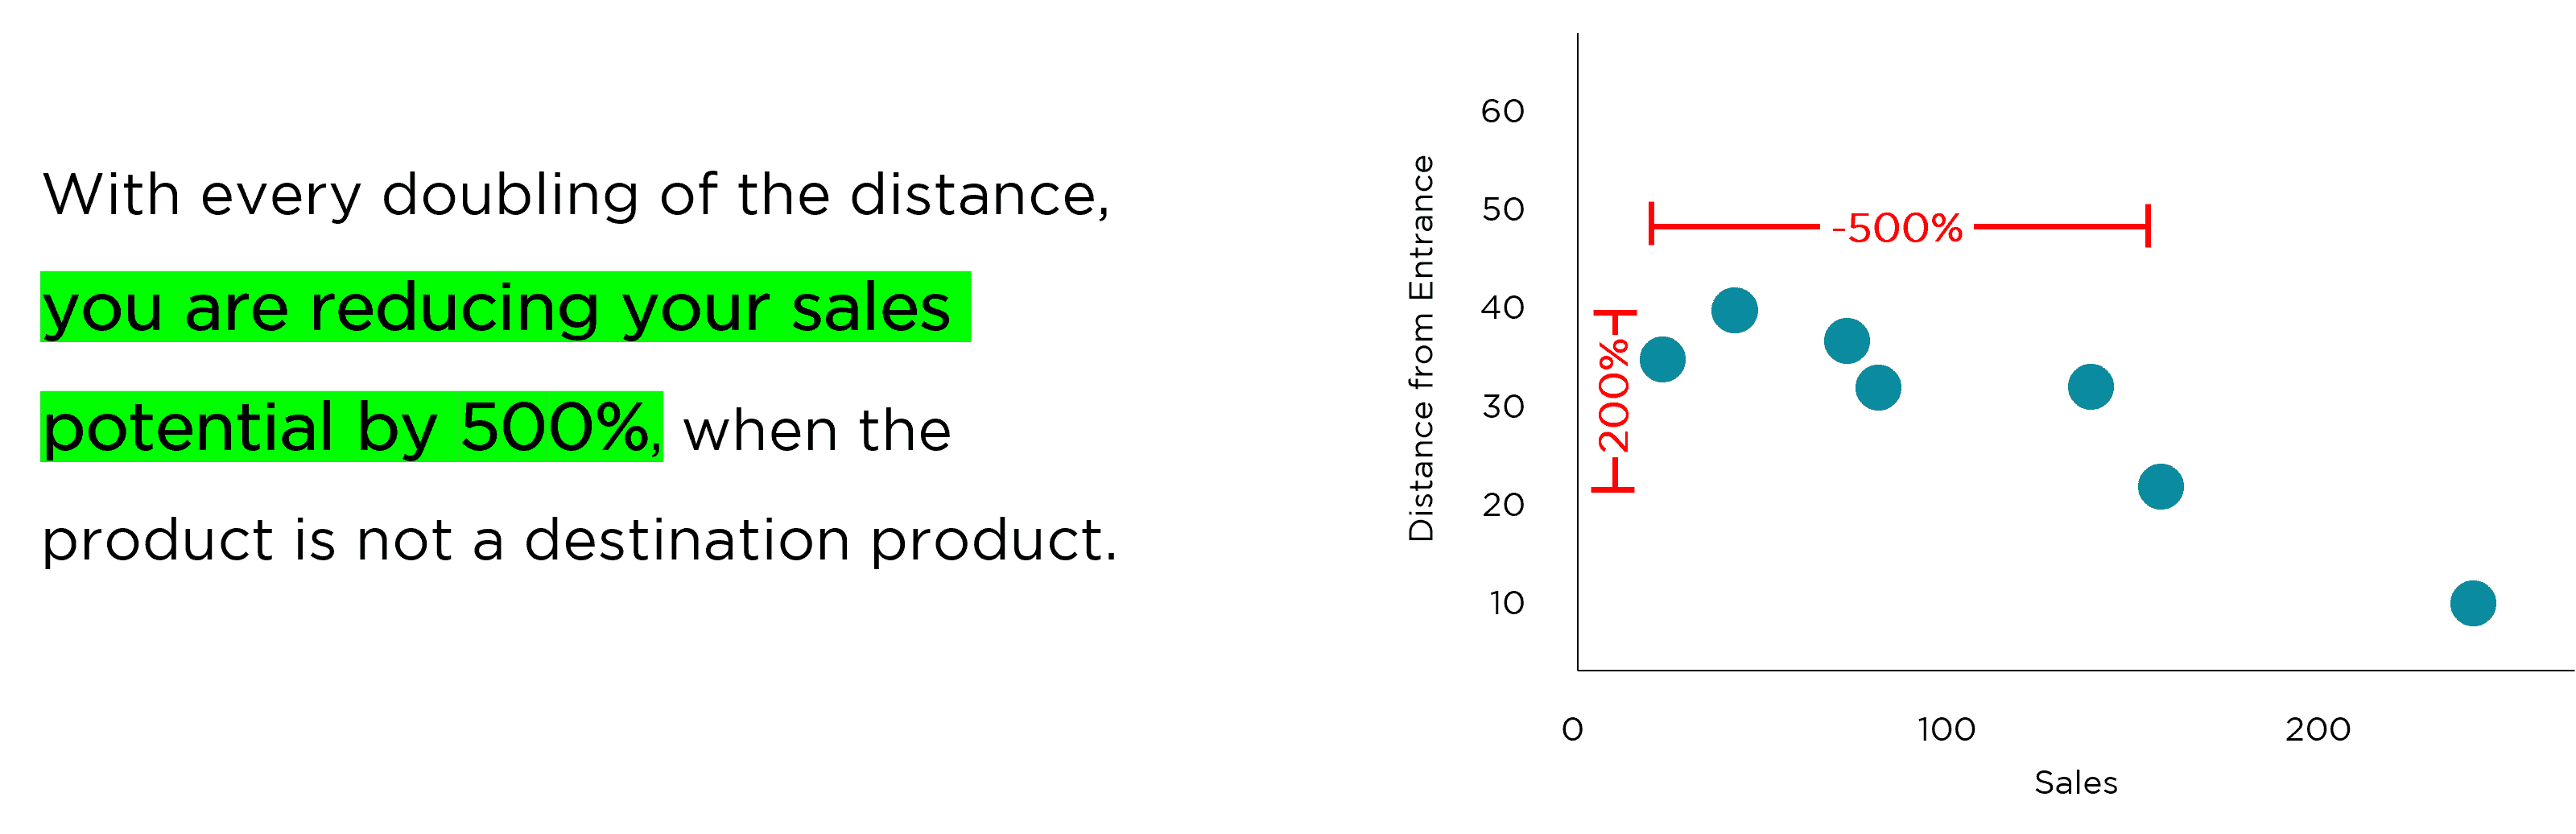
Figure 7: A scatterplot illustrates the correlation between the distance of a product from the door and its associated sales.
Not every customer will traverse your entire store; typically, we observe that a product area is visited by no more than 15%-20% of visitors. Nevertheless, a crucial insight lies in the strong correlation between the location of a product within your store and its sales performance. As a general observation, every doubling of the distance results in a significant reduction of sales potential, estimated at 500%.
What should be the optimal size of a product area?
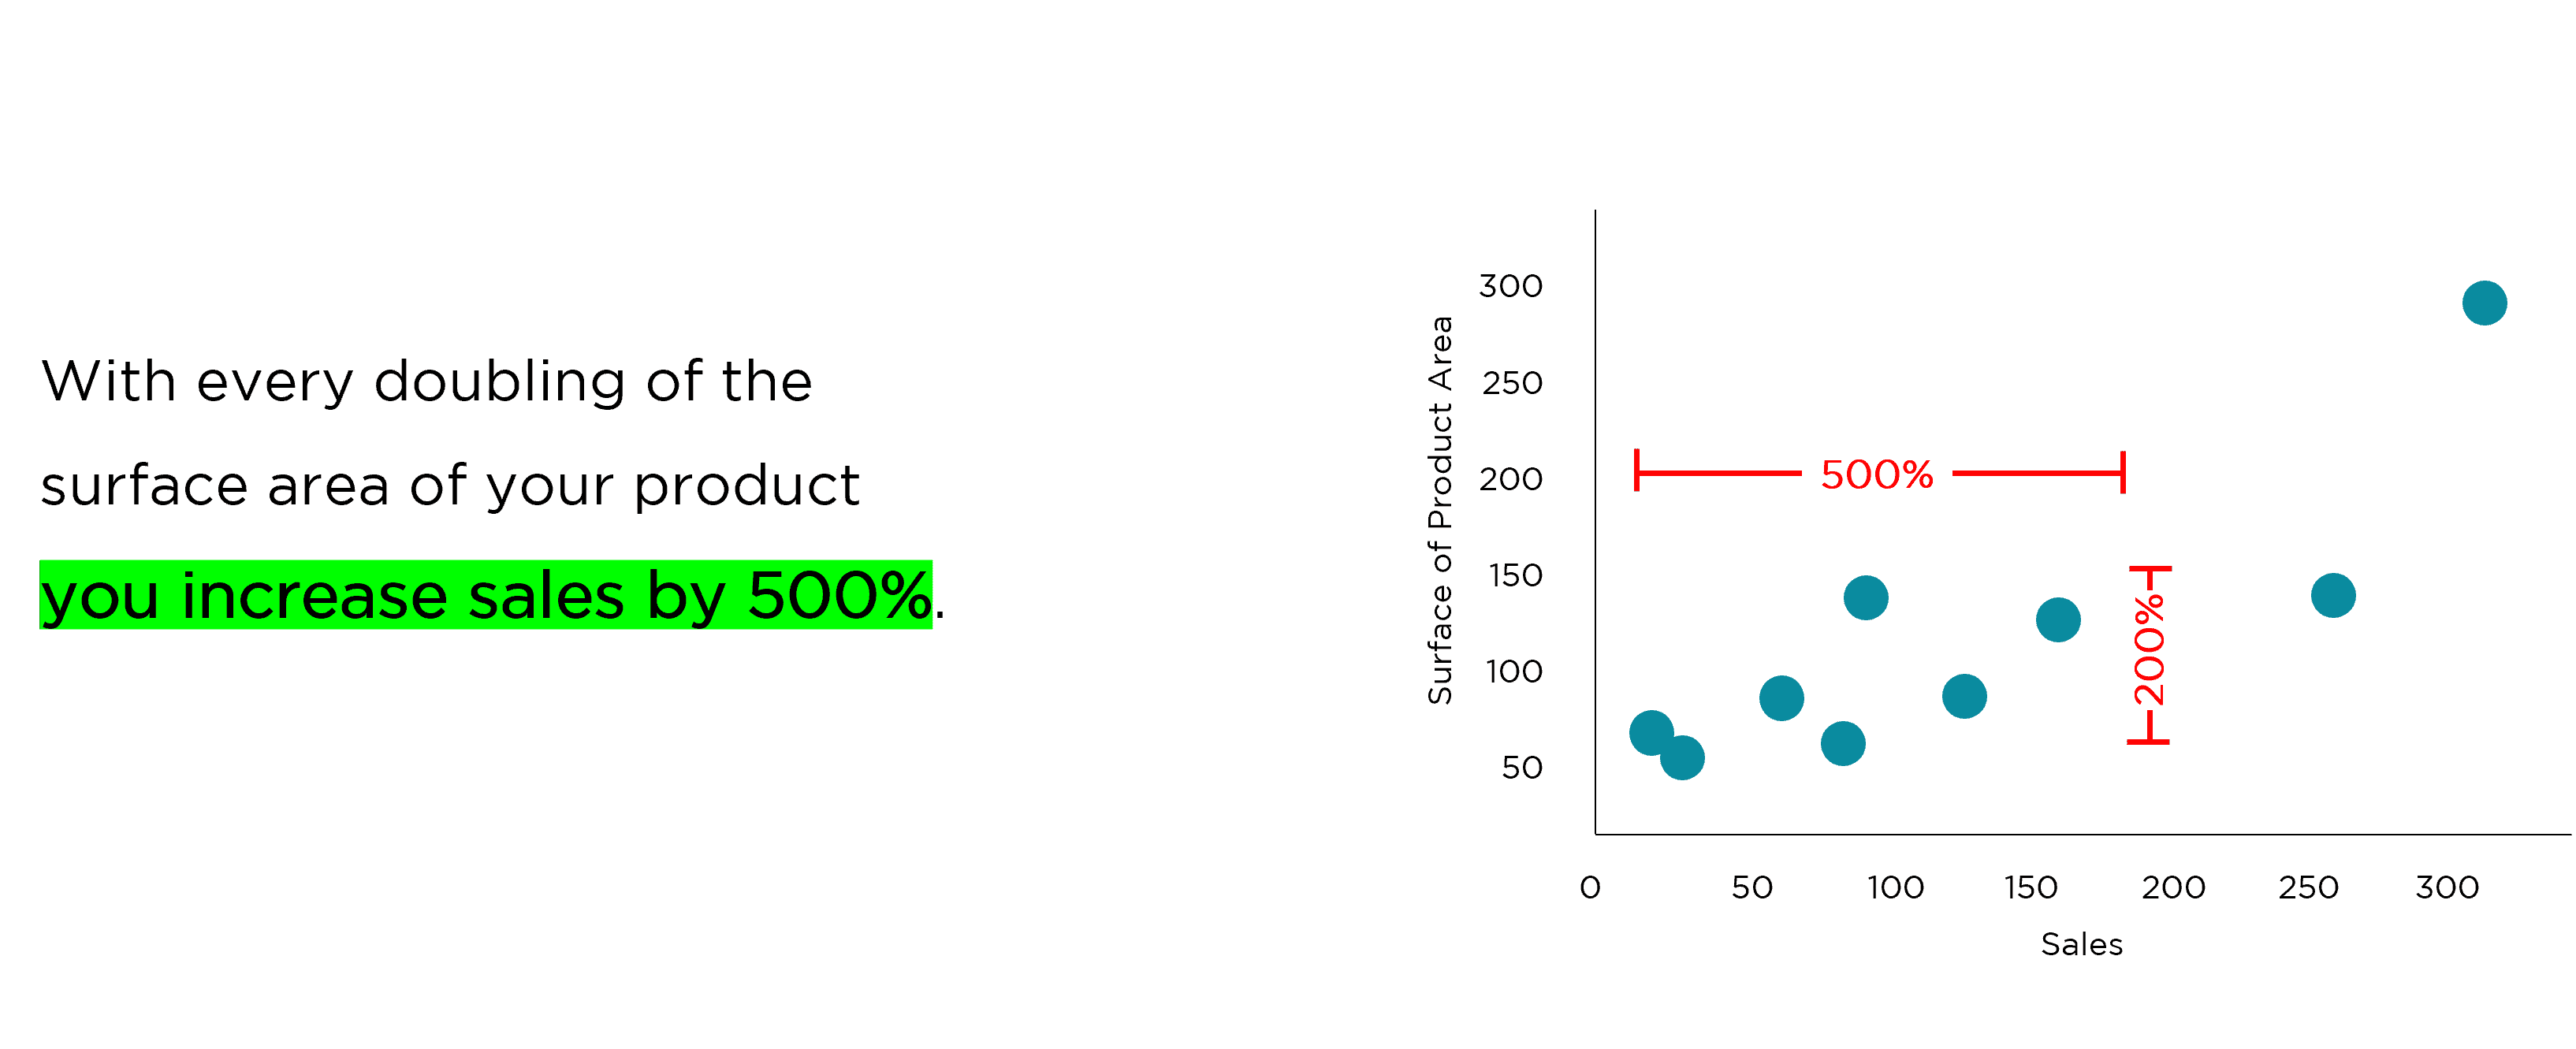
Figure 8: A scatterplot that visualizes the correlation between a product and its corresponding sales.
The commonly accepted principle contends that, in general, larger spaces yield better results. More precisely, with each doubling of the product area, the potential for sales escalation is notable, potentially even resulting in a fivefold increase (Figure 8). It's crucial, however, to recognize that this growth pattern may not uniformly apply to every product. Once the product area surpasses the threshold of 150 m2 (1500 ft2), a degree of unpredictability in consumer behaviour starts to manifest. Beyond this point, factors influencing consumer choices become more diverse, necessitating a nuanced approach to optimize sales performance.
How many alternative paths should be introduced within your store?
Figure 9: An animated visualization depicting the flow of visitors in a retail store.
The optimal solution appears to be adopting a single dominant path, a lesson effectively imparted by IKEA to the world. Nevertheless, operational considerations or safety concerns for employees may require the introduction of shortcuts. It's important to note that for every shortcut introduced in your store, there is a corresponding 13% to 18% reduction in visitor traffic, resulting in a proportional loss of generated revenue.
Omnichannel Marketing Optimization
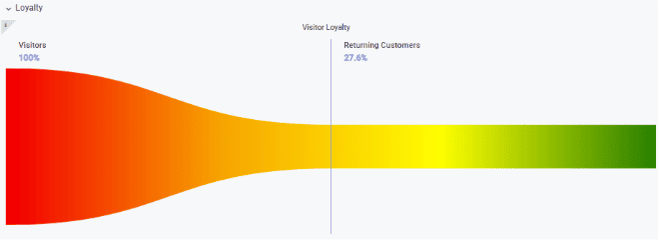
Figure 10: A funnel depicting the ratio of visitors who are willing to join a loyalty program throughout the day.
veryone, everywhere will always have a small group of fanatic customers. The one who benefits the most though is the one who listens to them and learns from them. To enable them to communicate with you, you will need them to join your loyalty program. Two questions for Omnichannel Marketing:
- How many customers will enrol in your loyalty program?
- Can I communicate with loyal customers as they pass by my store?
How many customers will enrol in your loyalty program?
Figure 11: An animated example illustrating a push notification in the physical world. As shown in the figure, a visitor enters the store. An employee promptly receives a message inviting them to serve the customer, given that the same customer was assisted by the same employee during their last visit to the store. Throughout this interaction, the two may exchange messages for seamless communication.
Don't hesitate! Our data (Figure 10) reveals that achieving a 27% participation rate in your loyalty program is entirely achievable. This is fantastic news because it grants you the opportunity to communicate with this substantial customer base. Consider this: if your store attracts 3500 visitors daily, and 27% of them join your loyalty program each day, coupled with an online sales campaign. If 8% of these participants make a purchase, you'll gain a remarkable 76 new customers for your online store every day!
Can I communicate with loyal customers as they pass by my store?

Figure 12: An animated example illustrating a push notification in the physical world. As depicted in the figure, a visitor is passing by the store until she receives a push message emitted from Ariadne. At this moment, she alters her path and enters the store.
The next time a loyal customer steps into your store, the employee who assisted them during their previous visit may receive a notification. Statistically, if a customer returns for a second visit, there is a 60% increased likelihood of making a purchase. On the other hand, if a loyal customer passes by your store, they can now receive a message, serving as a reminder to pay you a visit. Harness the power of timely communication to enhance customer engagement!
Optimizing Employee Scheduling
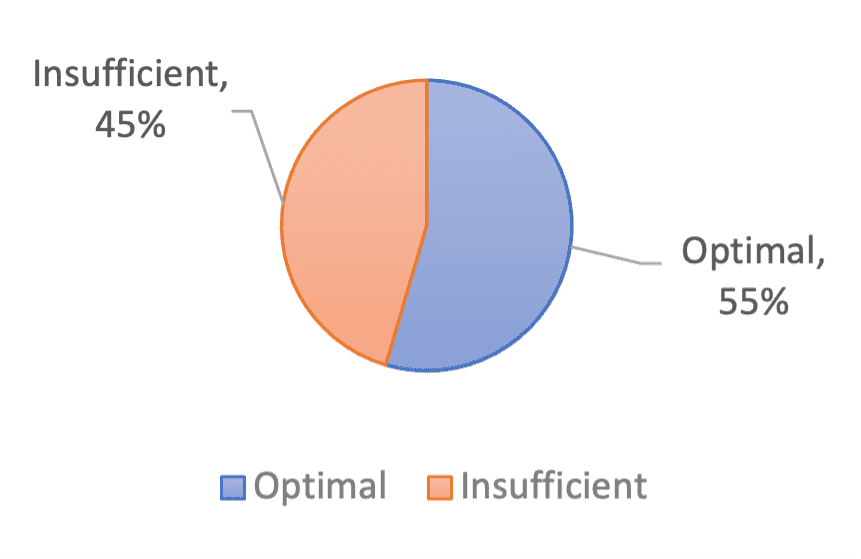
Figure 13: A pie chart visualizing the level of optimized scheduling identified thus far by Ariadne for our customers.
We have consistently found that the efficiency of even the most advanced employee scheduling programs rarely surpasses 50% optimization. Common pitfalls include either failing to schedule employees during peak demand periods or overscheduling during slow periods when the store sees fewer customers. This issue predominantly arises from following outdated scheduling principles rooted back in the industrial revolution.
A retail business differs significantly from a factory, and employee shifts need not commence simultaneously, as in a production line. By strategically aligning the arrival times of your employees with customer arrival peaks, you can potentially double your revenue, enhance customer satisfaction, reduce employee commuting time, and even contribute to environmental benefits by minimizing simultaneous commuting citywide. The key lies in breaking away from antiquated scheduling norms and embracing a dynamic approach tailored to the unique dynamics of retail operations.
In the battle against e-commerce, your store's ultimate weapon is none other than human interaction. Your sales representatives hold the key to unlocking this secret advantage. With the ability to provide a personalized shopping experience and foster meaningful connections with visitors, your team can achieve a level of engagement that is challenging to replicate online.
Consider the invaluable benefits of cultivating loyal customers. These devoted patrons not only contribute to increased revenue by spending more and making frequent purchases but also bring about cost savings. Retaining customers proves to be a more cost-effective strategy than constantly acquiring new ones, resulting in reduced marketing expenses. Furthermore, the loyalty of customers translates to a higher customer lifetime value (CLV), generating sustained revenue over the course of their association with your brand.s
Loyal customers go beyond mere transactions; they become advocates for your brand. Through word-of-mouth and referrals, they amplify visibility, drawing in new customers. Additionally, their commitment provides a valuable feedback loop, offering insights that businesses can utilize to enhance products and services, ensuring they consistently meet customer needs. In essence, the power of human interaction in your store not only drives immediate sales but also sets the stage for long-term success and growth.
